Comparison of quarter-century fluctuations of dollar index and gold price

report reporter of Mehr, on Wednesday the world price of an ounce of gold, after returning from its highest historical record (2758 dollars and 40 cents) with a decrease of more than one percent, at the price of 2721 dollars and 30 The tradition was closed that today we again saw the increase of 15 dollars of this precious metal.
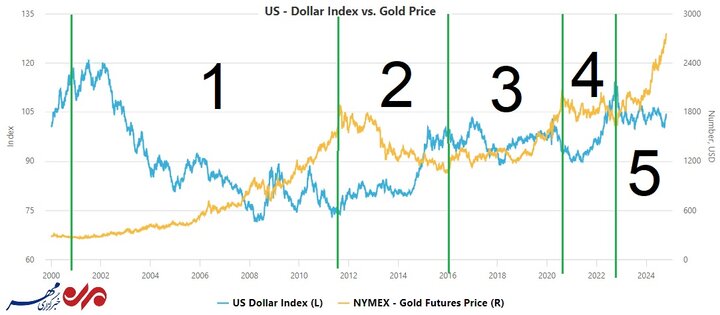
Under the pretext that economic analysts believed that one of the reasons for the retreat of the gold price yesterday was the strengthening of the US dollar index. We will pay the following diagram.
Quarter-century chart of changes in the US dollar index and the world price of an ounce of gold
Examining this chart and dividing it into 5 time periods clearly shows that the US dollar index and the world price of an ounce of gold act opposite to each other and the increase of one decreases the other. brings For example, from 2002 and at the same time as the first signs of the financial crisis of 2008 appeared in 2005, until the end of this financial crisis before 2012, gold experienced a price increase of about 500% along with the decrease of the dollar index. The price reached 6 times from 300 dollars to 1800 dollars.
This inverse effect can be seen in other time periods as well, and now analysts believe that if the dollar index is able to break the 105 points resistance area, there is work for further growth. Gold will be hard, and if this event is accompanied by a decrease in the level of geopolitical tensions, we should wait for a price or time correction in the ounce of global gold.
Nevertheless, gold has always been a safe haven for investors amid geopolitical tensions, so they are currently more than all are worried about the possibility of increasing and developing the level of tension and conflicts in West Asia, although in addition, there is uncertainty about the upcoming US presidential election and the monetary policies adopted by the central bank of this country after the election. .


